The Great Wargaming Survey (GWS) accepts voluntary responses from any participant completing the survey. No random sampling mechanism is in place. Sampling is by convenience. Since a respondent must have knowledge of the survey, access to the questionnaire to participate, and an interest in wargaming, the final dataset is naturally constrained to this population. For each annual survey, all respondents submitting a survey (excluding those having data quality issues) are included in a cross-sectional study. Cross-sectional studies collect data from many subjects at a single point in time.
The relaxation of random sampling methods may introduce bias. Having a sample not drawn randomly, a sample may not fully represent the population as a whole. Inferences may be misleading. The possibility of sampling bias has been a regular concern raised by more than one reader over the years of publishing aggregated survey results.
Is the concern for sampling bias justified? Does a sample size hovering around 10,000 annually mitigate bias? Can survey analysis provide reasonable and useful results in the face of potential sampling bias?
What if the same target population is sampled at regular intervals? Does repeated sampling improve confidence in the underlying method? At each interval (annually for the GWS), the survey collects a different sample of the target population. This is a repeated cross-sectional study. Repeated cross-sectional studies can be used for analyzing population changes over time even though the samples, themselves, are not identical.
To gain confidence in the methods used and results presented, each survey ought to be drawing similar samples from the target population.
To assess this hypothesis, a few of the demographic attributes are selected for the years 2016-2022.
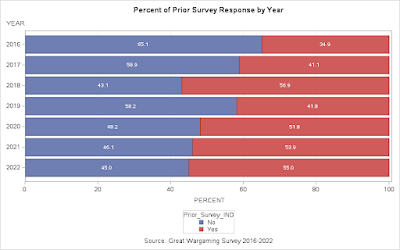
Prior Survey Response by Year
In a repeated survey, the earliest years ought to see fewer repeat respondents than in later years as the probability of having completed the survey increases. What is interesting is that the percentage of repeat respondents stabilizes at about 50% since 2020. About half of each sample is generated by respondents not participating in the survey before. Surprising result?
Years Spent Wargaming by Year
When capturing the number of years spent wargaming, besides 2016 and 2017, the percentage of respondents in each duration bin are relatively stable. Wargamers gaming 31 years or more remains locked into the upper 30% range.
Respondent Location by Year When examining respondent location over time, again, the time series remains stable.Age Group by Year Examining the time series by age shows an interesting but not unexpected result. Given that prior analyses suggest that the population of wargamers is getting older in aggregate, samples drawn from a similar population ought to produce this tendency. The chart below exhibits the tendency of older cohorts increasing over time.Primary Interest By Year Finally, consider a respondent's primary interest in wargaming.
Over time, we see a shift from Fantasy/Sci-Fi to both Mixed, and Historicals. Given the tendency for non-historical wargamers to gravitate away from preferring purely non-historical wargaming as they age, the underlying samples seem drawn from similar populations.
While GWS samples may not be drawn randomly, the hypothesis that these data are drawn from similar populations across time should not be rejected outright. Can results from several years of the GWS be relied upon for useful inferences on the population of wargamers? The answer is up to the individual. I know my position.


